
Call Performance Dashboard
Call Performance Dashboard Overview
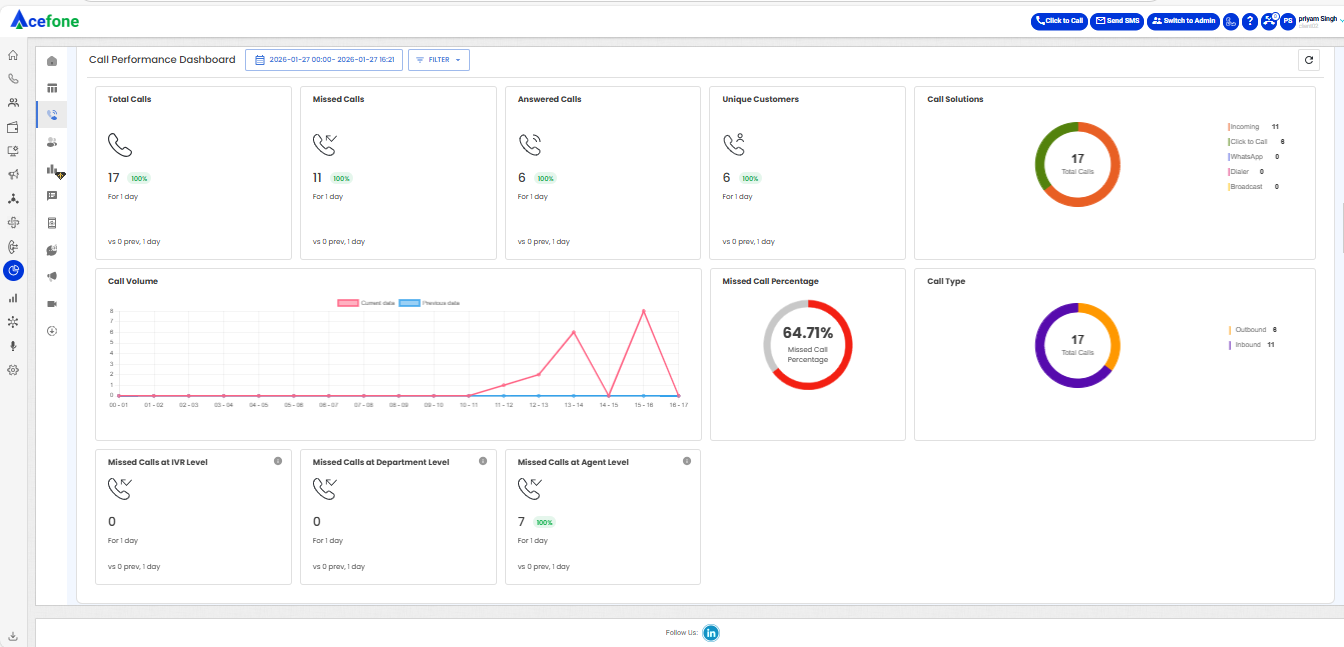
The Call Performance Dashboard provides a detailed view of call-related KPIs (Key Performance Indicators), allowing users to monitor and evaluate call metrics.
Getting Started with Call Performance Dashboard
To go to Call Performance Dashboard to your Acefone account, first log in using your unique User ID and Password. Once logged in, you will be directed to the main dashboard. From there, locate the navigation menu on the left-hand side of the screen and click on "Insights". You will land on the Insights Dashboard; from there, click on Call Performance Dashboard, which is located just to the right-hand side of the navigation menu on the top-left corner of the screen.
Below is the explanation of its main components:
- Date Selection
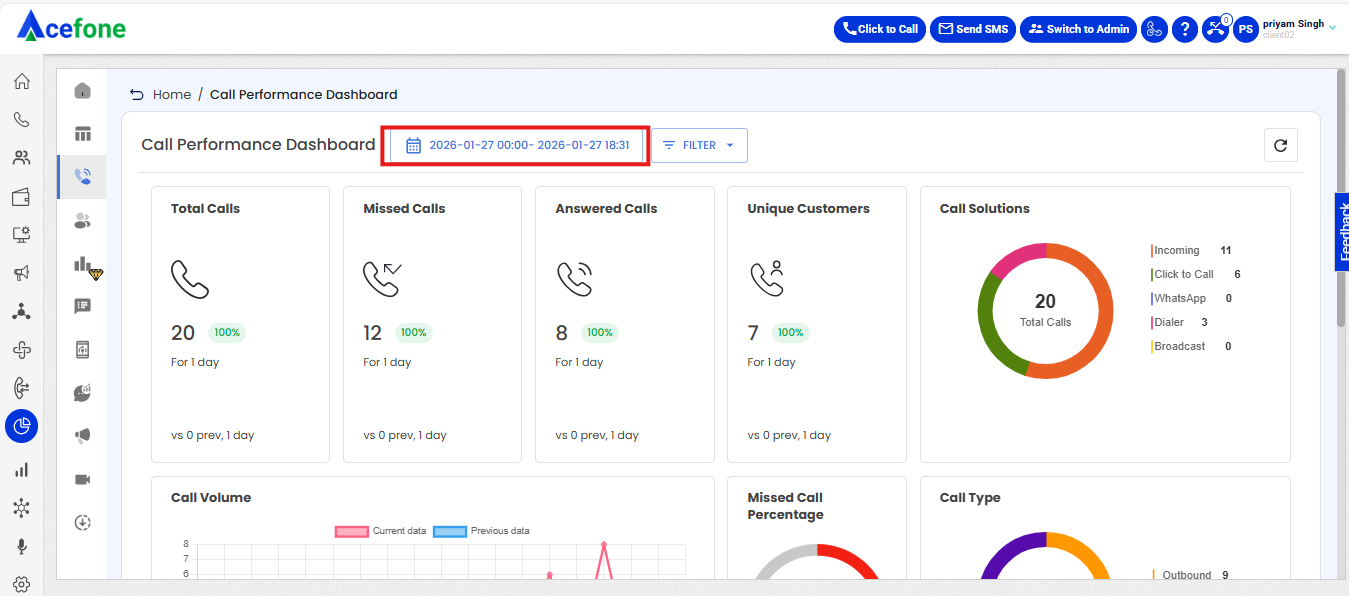
- Click on the date selection tool, as shown in the screenshot above.
- The date selection tool allows users to define the time range for the dashboard data. Users can select predefined ranges (e.g., Last 7 Days, Last Month) or choose a custom time frame by specifying start and end dates/times. However, the filter allows selection of a maximum of 30 days in one go to ensure optimal performance and data accuracy.
- Filters
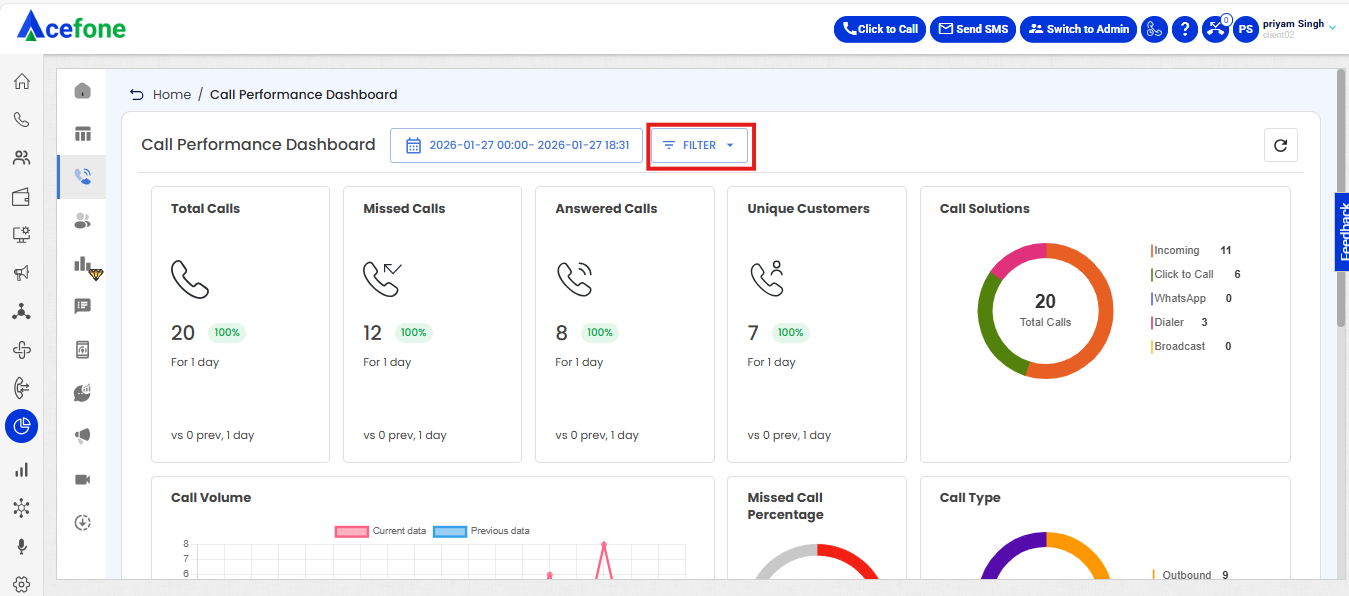
Click on the filter tool, as shown in the screenshot above.
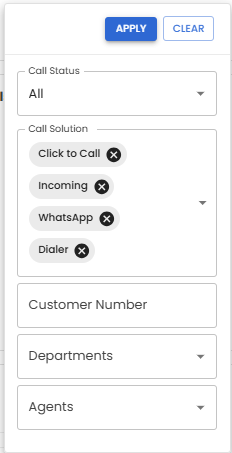
The Filter option allows users to narrow down the displayed data based on specific criteria:
| Field | Description |
|---|---|
| Call Status | Filters calls by their status (All, Missed, Answered). |
| Customer Number | Filters calls based on a specific phone number used to make or receive calls. This helps in analyzing call activity linked to that particular number. |
| Departments | Searches for specific calls using their unique call ID. |
| Call Solution | Filters based on the call solution type, such as Click-to-Call, Incoming, Dialer, or Broadcast. Note: Broadcast can only be selected as a standalone option and cannot be combined with other call types during filtering. |
| Agents | Allows filtering calls by a specific customer number, referring to the consumer number, i.e., the phone numbers of your customers. |
- Metrics Displayed at the Top
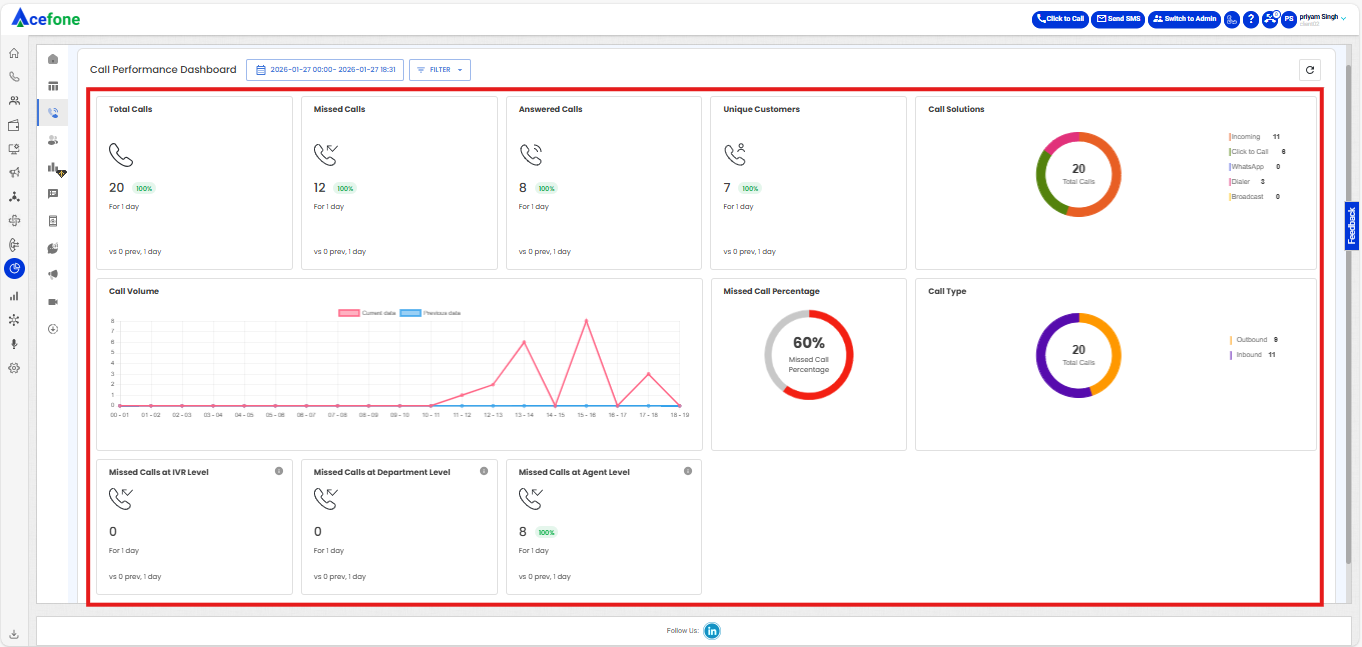
The main metrics displayed at the top include:
| Field | Description |
|---|---|
| Total Calls | The total number of calls (incoming and outgoing) handled in the selected time period. |
| Missed Calls | The number of calls that were missed (not answered) by an agent or platform (missed on the department, missed on IVR, etc). |
| Answered Calls | The total number of calls that were successfully answered. |
| Unique Customers | The number of distinct customers who called during the selected time frame. Possible cases: 1. Unique Phone Numbers: A customer’s phone number is counted only once, even if they call multiple times. 2. Unique Customer IDs: If customers have unique IDs, it counts each customer only once. 3. Unique Incoming Calls: If someone calls the business, their number is counted as 1 distinct customer, even if they call multiple times. 4. Unique Outgoing Calls: If you call customers, each phone number you call is counted as a distinct customer. |
| Call Solutions | Displays the breakdown of calls by their product (Incoming, Click to Call, Dialer, Broadcast). |
| Call Volume | This graph serves as the Hero Widget on the dashboard, helping users compare current data with past data for the same period, making it easy to spot trends and changes. How It Works: 1. Compare Current and Past Data: The widget shows current data (e.g., last 30 days) as one line on the graph and the previous period as another line. 2. Custom Date Ranges: Users can select any date range, and the widget automatically compares it with the same length of time before. 3. Clear Visuals: The graph uses simple visuals to show trends. 4. Helps You Take Action: By comparing current and past data, users can make data-driven decisions. |
| Missed Call Percentage | Shows the percentage of missed calls relative to the total calls made or received. |
| Call Type | Segregates calls by type (Inbound, Outbound). |
| Missed calls at IVR level | Calls that reached the IVR system but were not answered or routed. |
| Missed calls at Department level | Calls that routed to a department but were not answered by any agent. |
| Missed calls at Agent level | Calls that were directed to specific agents but not answered. |
- Refresh Data
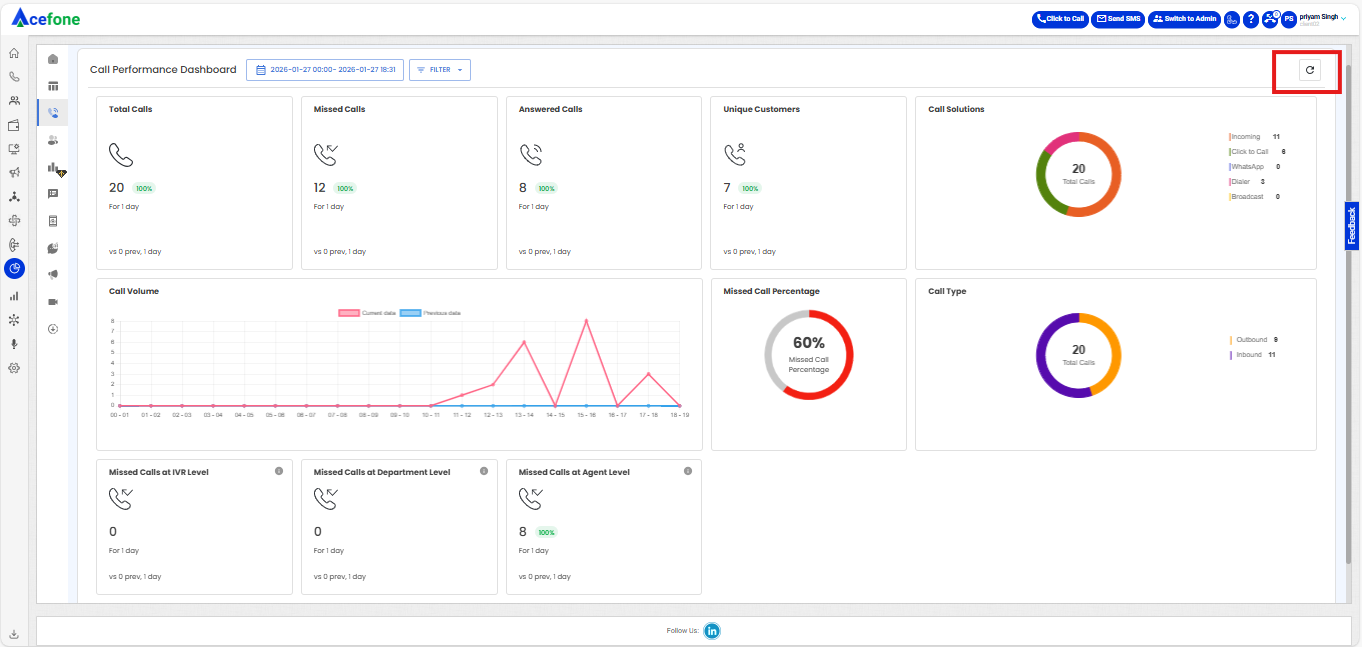
- Refresh options are located in the top-right corner of the Call Performance Dashboard:
| Field | Description |
|---|---|
| Refresh Icon |
|
FAQs
- Why is my call marked as a missed call even when I see there is some talktime in the call log?
- Our platform marks a call as a missed call in case the talktime over a call is less than 1 second. This is known system behavior, and we will not be able to manually change the call status from missed to answered.
- Understanding the Difference Between Call Performance Dashboard and Agent Performance Dashboard
Call Performance Data (CPD) and Agent Performance Data (APD) are distinct datasets and are not directly comparable.
- CPD focuses on calls — analyzing the full lifecycle of each call, including IVR flows, call routing, and abandonment.
- APD focuses on agents — tracking individual agent performance metrics like answered/missed calls, talk time, and wrap-up duration.
Example:
If one customer call is routed to 5 agents but answered by only 1:
- CPD records 1 call
- APD shows 5 agent interactions (4 missed, 1 answered)
🔍 Use APD to assess agent responsiveness and productivity.
📈 Use CPD to study call volume trends and system performance.