
Agent Performance Dashboard
Agent Performance Dashboard Overview
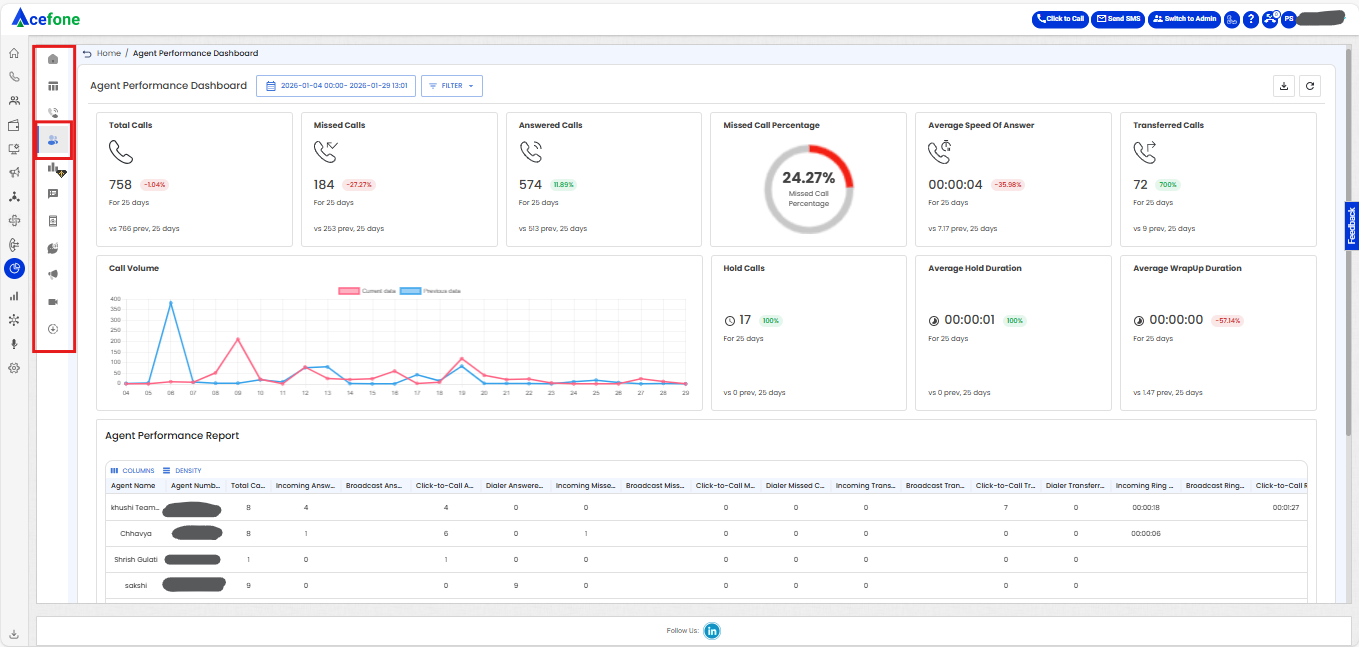
- The Agent Performance Dashboard provides an in-depth analysis of agent activities and call performance over a selected time period. This dashboard allows managers to monitor key metrics and performance indicators related to call handling, enabling informed decision-making and performance optimization.
Getting Started with Agent Performance Dashboard
- To access the Agent Performance Dashboard in your Acefone account, first log in using your unique User ID and Password. Once logged in, you will be directed to the main dashboard. From there, locate the navigation menu on the left-hand side of the screen and click on Insights. You will land on the Insights Dashboard; from there, click on Agent Performance Dashboard, which is located just to the right-hand side of the navigation menu on the top-left corner of the screen.
- Date Selection
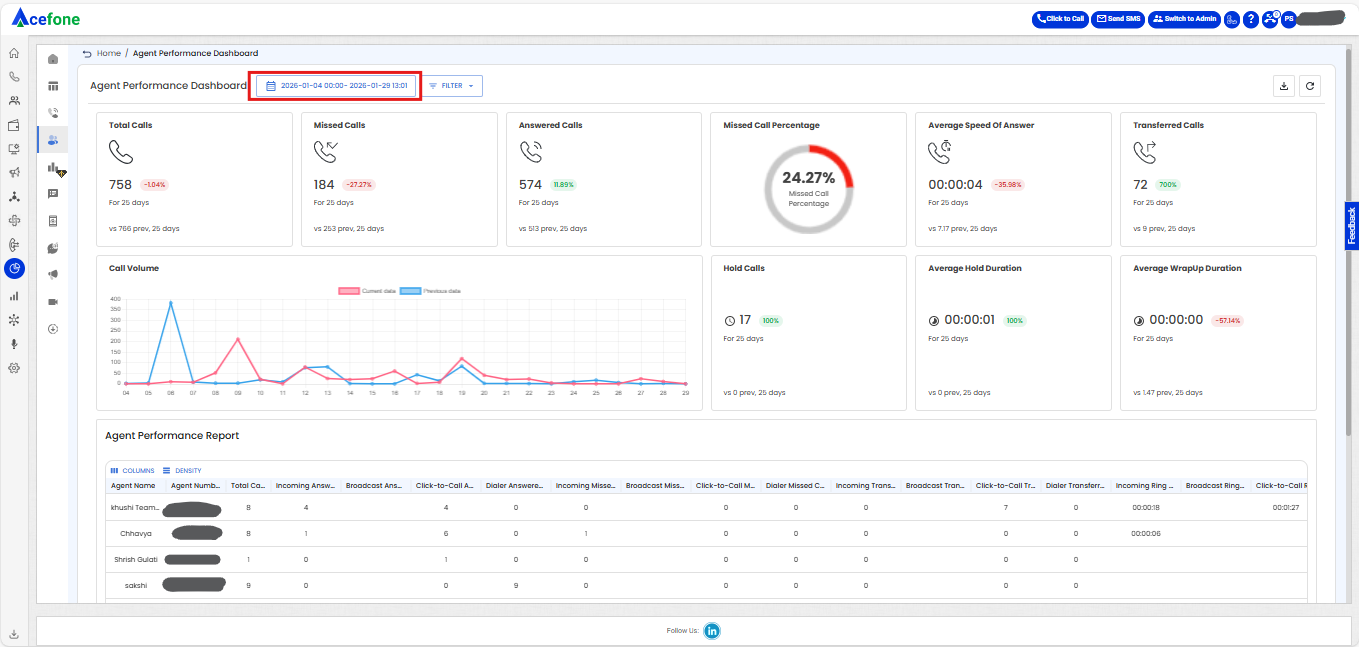
- Click on the date selection tool, as shown in the screenshot above.
- The date selection tool allows users to define the time range for the dashboard data. Users can select predefined ranges (e.g., Last 7 Days, Last Month) or choose a custom time frame by specifying start and end dates/times.
- Filters
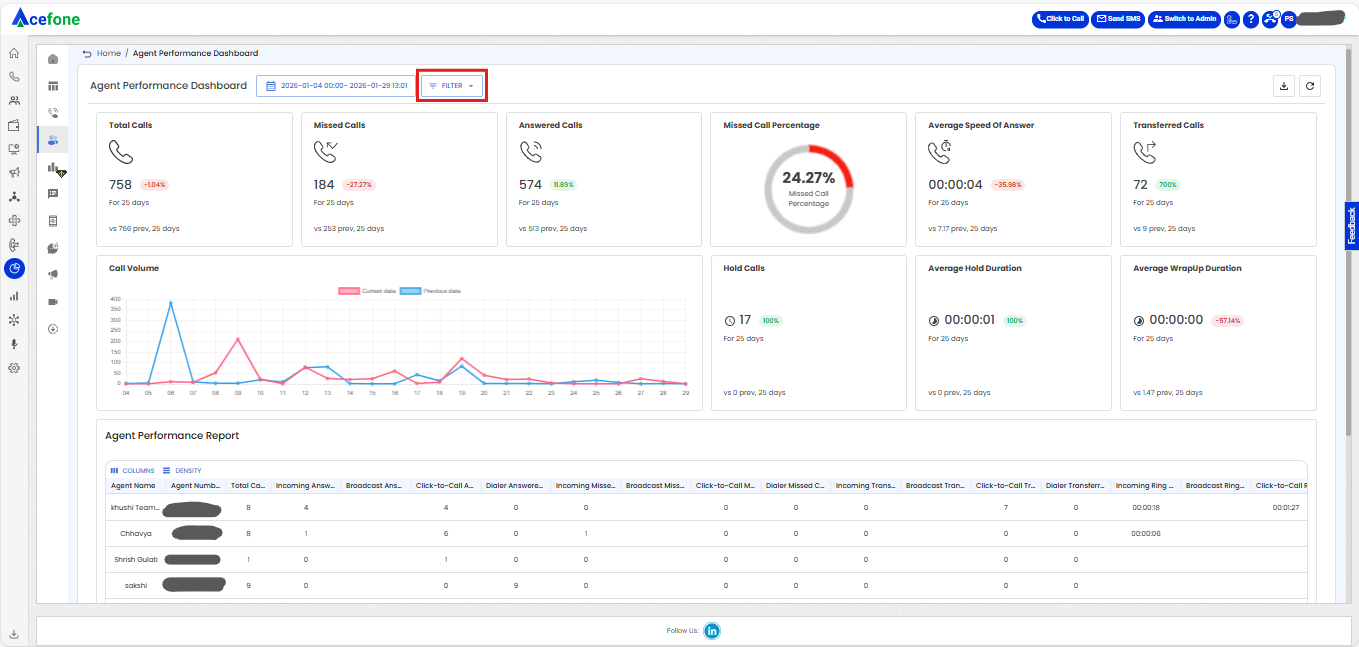
- Click on the filter tool, as shown in the screenshot above.
- The Filter option allows users to narrow down the displayed data based on specific criteria:
| Field | Description |
|---|---|
| Call Status | Filters calls by their status (All, Missed, Answered). |
| Call Solution | Filters based on the call solution type, such as Click-to-Call, Incoming, Dialer, or Broadcast. Note that Broadcast can only be selected as a standalone option and cannot be combined with other call types during filtering. |
| Agent | Allows filtering by specific agents. |
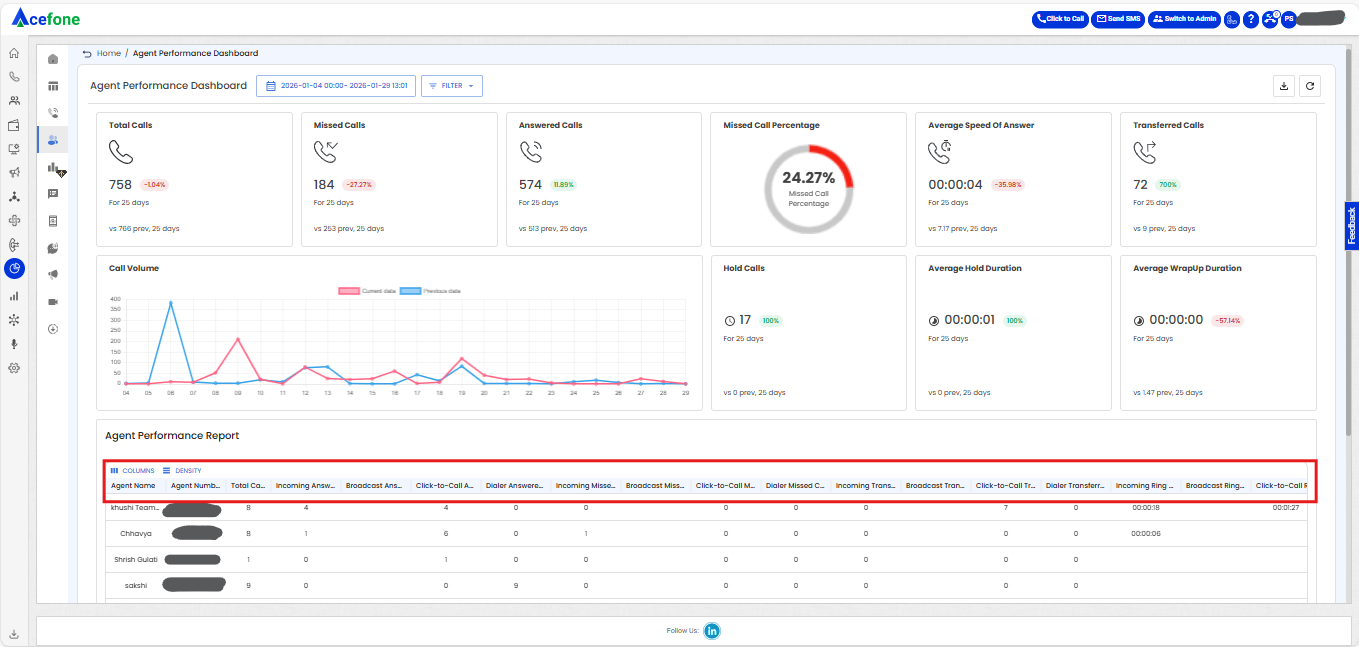
- Metrics Displayed at the Top
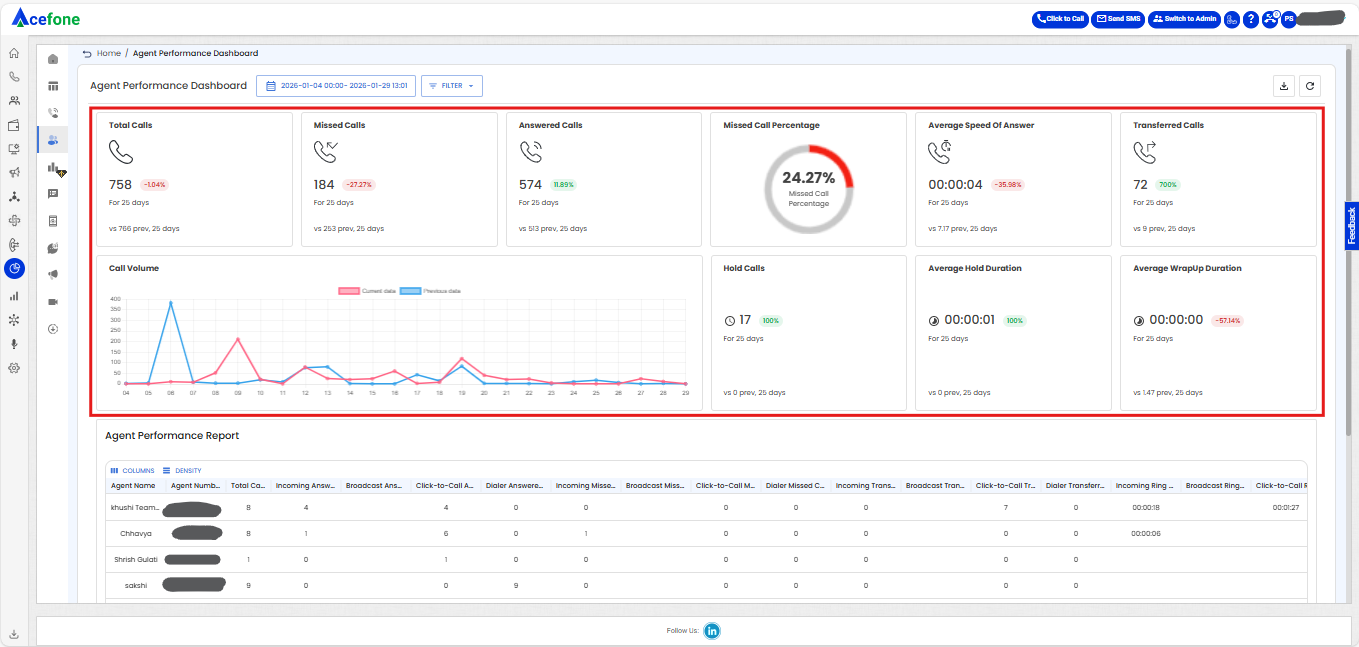
- The main metrics displayed at the top of the Agent Performance Dashboard are:
| Metric | Description |
|---|---|
| Total Calls | The total number of calls (inbound and outbound) handled over the selected period. Includes both answered and missed calls. Comparison percentage with the previous period is shown for performance analysis. |
| Missed Calls | The number of calls missed by agents during the selected period. It also indicates the percentage change compared to the previous period, helping to monitor trends in missed call handling. |
| Answered Calls | The number of calls successfully answered by agents within the selected period. Includes the percentage change compared to the previous period for performance evaluation. |
| Missed Call Percentage | The proportion of total calls that were missed, represented as a percentage. Helps identify the effectiveness of call handling and can be used to analyze agent availability or workload. |
| Average Speed of Answer | The average time it took agents to answer calls during the selected period. Indicates how quickly calls were attended to and provides a percentage change compared to the previous period for benchmarking. |
| Transferred Calls | The number of calls transferred to other agents, departments, or queues during the selected period. Tracks internal call handling efficiency and includes a percentage comparison with the previous period. |
| Call Volume | The Call Volume is represented in the graph below the metrics, showing the distribution of calls over time. It includes: - A line graph comparing current data (in pink) with previous data (in blue). - The x-axis displays the date range, and the y-axis represents the number of calls. This graph helps analyze call trends over a selected period. |
| Hold Calls | The total number of calls that were put on hold by agents during the selected period. Helps in understanding the frequency of call holds, which can indicate process inefficiencies or the need for agent training. |
| Average Hold Duration | The average time customers were kept on hold during calls in the selected period. Useful for analyzing customer wait time and the effectiveness of hold policies or procedures. |
| Average Wrap-Up Duration | The average time agents spent on post-call tasks, such as updating notes or dispositions, during the selected period. A measure of efficiency in completing post-call work. |
- Key Performance Indicators (KPIs) at the Bottom
- The following KPIs provide data about agent performance and details:
| KPI | Description |
|---|---|
| Agent Name | The name of the agent handling calls. |
| Agent Number | The phone number assigned to the agent. |
| Intercom ID | The unique internal extension identifier for the agent. |
| Incoming Ring Time | The total time the phone rang for incoming calls before being answered. |
| Broadcast Ring Time | The ring time during broadcast calls (calls sent to multiple agents simultaneously). |
| Click-to-Call Ring Time | The ring time for calls initiated through the click-to-call feature. |
| Dialer Ring Time | The ring time for calls initiated through the dialer. |
| Incoming Transferred | The number of incoming calls transferred to another agent or department. |
| Broadcast Transferred | The number of calls transferred from a broadcast group to another agent or department. |
| Click-to-Call Transferred | The number of click-to-call calls transferred to another agent or department. |
| Dialer Transferred | The number of calls transferred from the dialer to another agent or department. |
| Incoming Answered Calls | The total number of incoming calls answered by the agent. |
| Broadcast Answered Calls | The total number of broadcast calls answered by the agent. |
| Click-to-Call Answered Calls | The total number of click-to-call calls answered by the agent. |
| Dialer Answered Calls | The total number of calls answered by the agent from the dialer. |
| Incoming Missed Calls | The total number of incoming calls missed by the agent. |
| Broadcast Missed Calls | The total number of missed calls during broadcast. |
| Click-to-Call Missed Calls | The total number of missed click-to-call calls. |
| Dialer Missed Calls | The total number of missed calls from the dialer. |
| Hold Duration | The total duration of time calls were on hold. |
| Hold Call | The number of calls that were put on hold. |
| Wrap-up Duration | The time spent by the agent in post-call wrap-up or after-call work. |
| Listen By Duration | The time spent by a supervisor or another person listening to the agent's calls. |
| Whisper By Duration | The duration of time a supervisor provided real-time coaching (whispered) to the agent during a live call. |
| Barge By Duration | The duration of time a supervisor joined an active call between the agent and the customer. |
| Listen To Duration | The duration of time calls were monitored (listened to) by someone else. |
| Whisper To Duration | The time during which another person whispered real-time instructions to the agent during the call. |
| Barge To Duration | The duration during which another person barged into the call to assist or provide feedback. |
| Listen By Count | The number of calls listened to by a supervisor or another person. |
| Whisper By Count | The number of calls where whispering was used to assist the agent. |
| Barge By Count | The number of calls where a supervisor barged into the call. |
| Listen To Count | The number of calls that were monitored by someone else. |
| Whisper To Count | The number of calls during which whispering was provided to the agent. |
| Barge To Count | The number of calls where someone barged into the call to assist or provide guidance. |
- Download Report and Refresh Data

- Download Report and Refresh options are located in the top-right corner of the Call Performance Dashboard:
- Steps to Download the Call Performance Report:
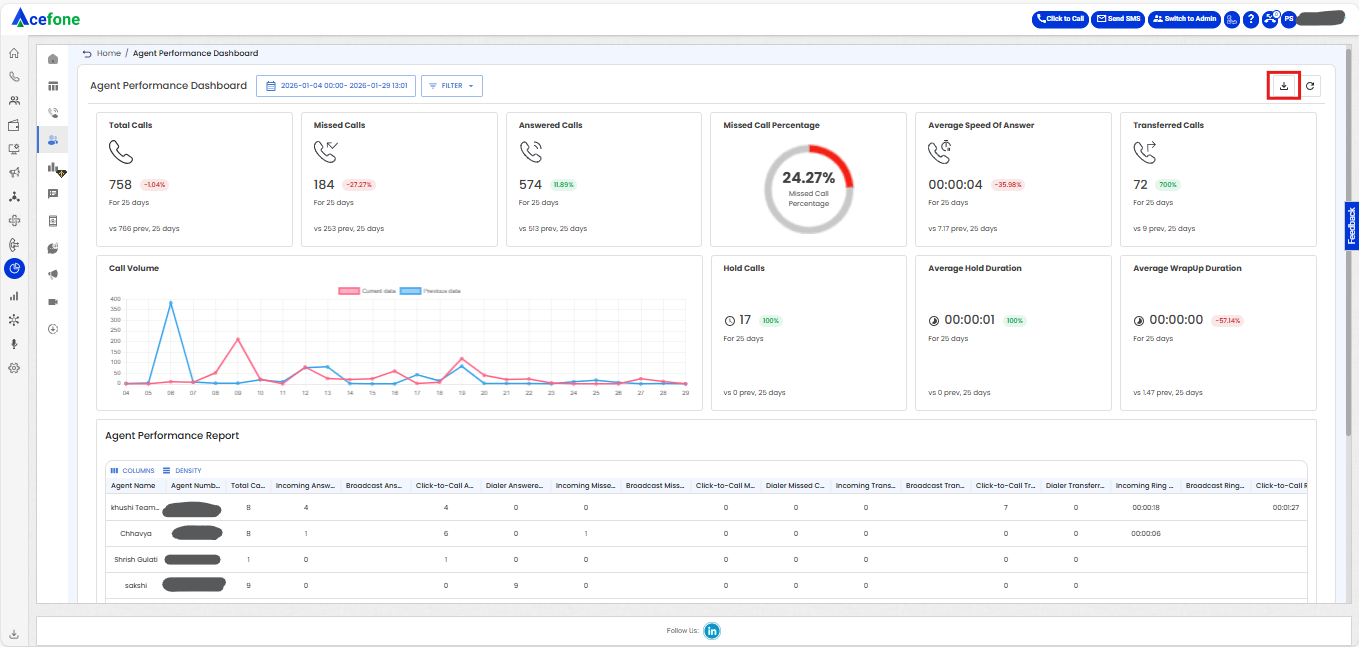
- Navigate to the Call Performance Dashboard and click on the Download icon located in the top-right corner (highlighted in the screenshot).
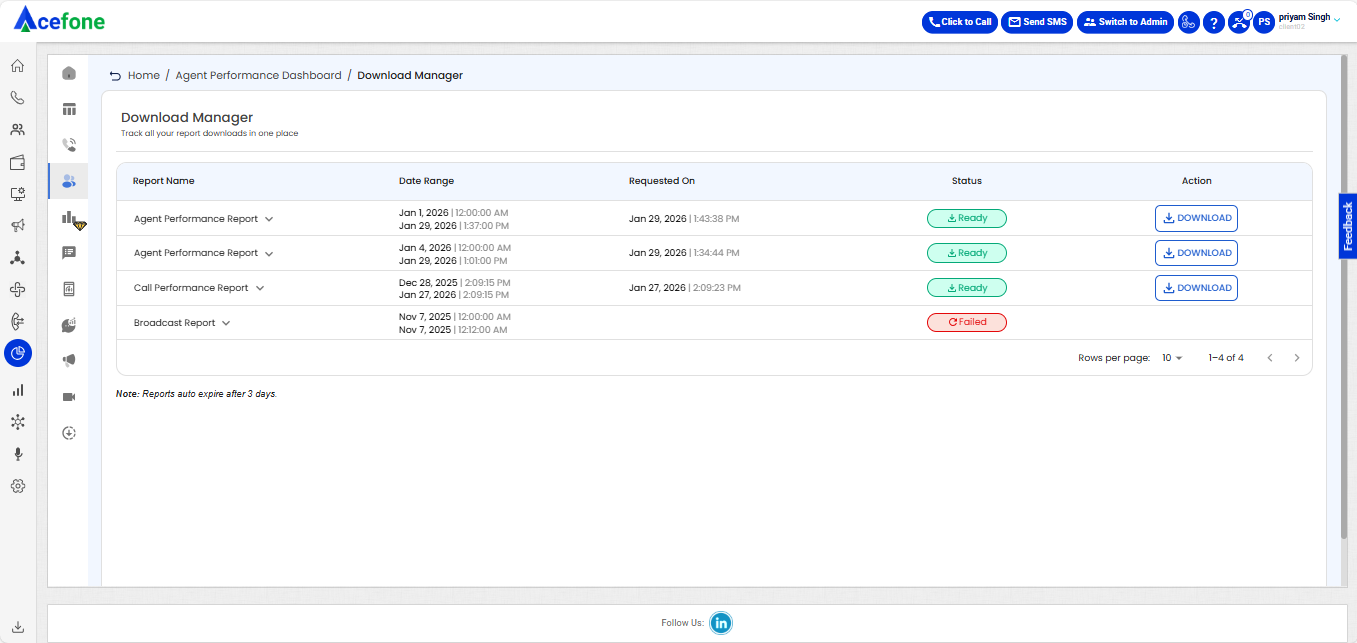
- After clicking, you will be redirected to the Download Manager page. The file status will initially appear as In Progress and will change to Ready once the download is prepared. You can then download the file by clicking the Download button under the Action column.
- The report will be will be saved to your device's default download location.
FAQs
- Why is my call marked as a missed call even when I see there is some talktime in the call log?
- Our platform marks a call as a missed call in case the talktime over a call is less than 1 second. This is known system behavior, and we will not be able to manually change the call status from missed to answered.
- Understanding the Difference Between Call Performance Dashboard and Agent Performance Dashboard
Call Performance Data (CPD) and Agent Performance Data (APD) are distinct datasets and are not directly comparable.
- CPD focuses on calls — analyzing the full lifecycle of each call, including IVR flows, call routing, and abandonment.
- APD focuses on agents — tracking individual agent performance metrics like answered/missed calls, talk time, and wrap-up duration.
Example:
If one customer call is routed to 5 agents but answered by only 1:
- CPD records 1 call
- APD shows 5 agent interactions (4 missed, 1 answered)
🔍 Use APD to assess agent responsiveness and productivity.
📈 Use CPD to study call volume trends and system performance.
Updated 3 months ago